Sewsan is a comprehensive computer program for the simulation, analysis and optimal design of sewer reticulation systems. The program uses the theory of contributor hydrographs for analysis and time simulation to determine the spare capacities in sewer systems taking cognisance of infiltration and leakage.
 Download Sewsan Download Sewsan
Buy Sewsan
Introduction
|
| Sewsan 2 |
|
| Sewsan 3 |
|
| Sewsan 4 |
|
| Sewsan 5 |
|
| Sewsan 6 |
| |
|
Sewsan is a computer application to simulate and analyse flow through sanitary sewer systems. The hydraulic simulation is based on the contributor hydrograph method. The contributor hydrograph for each pipe is made up of the following flow components:
- The local inflow to the pipe defined by the number and type of unit land parcels served by the pipe.
- Storm water ingress
- Infiltration
- Leakage
The hydrographs generated by each pipe are accumulated and routed downstream using time-lag routing. Bottlenecks in the system are identified at structures (manholes) where overflow occurs.
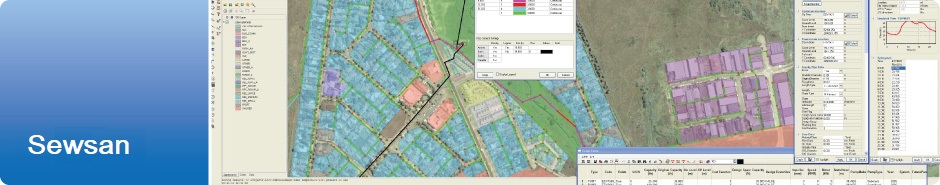
The Sewsan system is an analysis tool coupled to a GIS interface. All the model entities (pipes, manholes etc.) are stored in the GIS database, and are displayed on a map. The system data and results can also be viewed in tabular format in grids. Sewsan therefore consists of the following components:
- The sewer model representing the physical components of the sewer system
- Data and result tables
- The GIS interface
The program is very user friendly, with a menu driven structure and easy-to-use-and-understand interface between the graphical display/edit model, and the model database and results.
The latest version of Sewsan is available in 3 modules. All modelling aspects of the Sewsan hydraulic model lives inside the Albion GIS platform:
- A basic Capturing Model, which allows the user to capture the sewer network and check the integrity of the model.
- An Analysis Module in which the flow through the system can be simulated and the results of the simulation viewed. Bottlenecks in the system can be identified and the resulting overflow calculated.
- A Planning Module, which can be used to estimate required pipe diameters where bottlenecks in the system occur, pump capacities and rising main capacities.
Sewsan has been used for sewer system analysis and planning by GLS Consulting and other consultants in more than 50 major applications. Some of the more significant projects are:
- City of Ekurhuleni (South Africa)
- City of Tshwane (Pretoria, South Africa)
- City of Cape Town (South Africa)
- City of Johannesburg (South Africa)
- Local municipalities of the Western Cape, South Africa
Theory
Contributor hydrograph theory was originally developed by Shaw. The concept is very similar to using unit hydrographs for storm water system design. Each contributory unit (normally a single pipe in the sewer network) "contributes" a 24-hour sewer flow hydrograph to the system.
This hydrograph consists of:
- Local Inflow, contributed by the land parcels serviced by the pipe
- Leakage from plumbing into the system
- Storm water ingress into the system
- Ground water infiltration into the system
User supplied hydrographs representing the flow where other networks join the network being analysed, where pumps discharge into the network, or where a large system has to be fragmented
The local inflow to a pipe can be very accurately determined in Sewsan if the water consumption of the land parcels connected to the pipes is known. Sewsan then used the annual average daily demand (AADD) inflow calculation method. Alternatively the unit hydrograph peak inflow calculation method can be used.
The two methods differ in the calculation of the volume of the inflow hydrograph. The unit hydrograph peak method uses the expected peak flows associated with the landuse types to calculate the volume of the input hydrograph where as the AADD method bases the volume of inflow on the annual average daily water demand of all the land parcels serviced by the pipe.
The 24-hour contributor hydrograph for each pipe is routed down the network to the outfall manhole using time-lag routing. The time-lag is calculated using full-flow velocities in the pipes according to the Manning formula.
Modelled Components
The following structures can be accurately modelled in Sewsan:
- Gravity Pipes and Siphons
- Rising Mains and Pumps. Multiple rising mains may be linked to a pump structure
- Diversion structures. The percentage of flow routed through each of the pipes downstream of the structure is defined according to the total inflow to the structure
- Manholes and End Manholes
GIS Integration
|
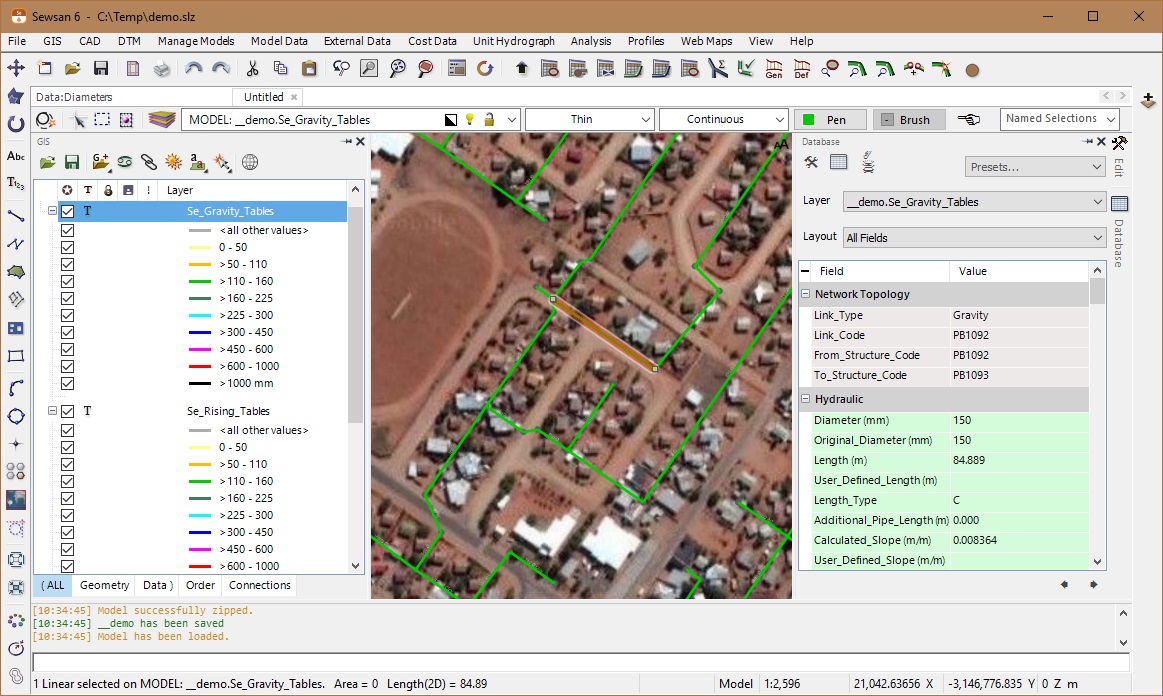
| GIS and imagery integration |
|
The GLS Version 6 software presents a completely new simplified approach to engineering modelling software where the engineering model lives inside a geographical information system (GIS)
- The engineering model is now embedded in our own powerful Albion GIS platform.
- The power of GIS can now be applied to the engineering model, allowing the modeller to directly harness GIS tools when creating and editing datasets.
- For example, spatial correlation can be used to extract text, such as pipe diameters from CAD or other GIS sources and apply it directly to the pipe entities of a hydraulic model.
- Another example would be to select part of the model using a spatial query, then refine the selection using a SQL text query. Finally the resulting filtered dataset can be populated interactively with data. This works directly on the engineering model.
- The more advanced modeller can create extensive selection or update queries using SQL, and see the effect immediately rendered in the GIS based model
- Model tables are now dynamic, fast and practically unlimited in size. There are no more tabs on spreadsheet tables. The modeller can have multiple user customizable layouts with field groupings in colour.
- All model operations are now also fully undo-able.
- Imagery web services, such as from Google™, Mapbox™, Microsoft™ or OpenStreetMap are now available to load background imagery at the geographically correct coordinates.
- External CAD sources (for example AutoCAD™ DWG or DXF files) or GIS sources (for example ESRI™ Shape files or ESRI file or folder geodatabases) can be opened in Wadiso and then transformed into GIS-based models. After completing the analysis or design, these models can later be exported again as GIS datasets. Through Albion, access to server-based GIS resources stored on PostgreSQL or Microsoft™ SQLServer databases.
User Interface
Sewsan features characteristics that provide for easy, informative use. These include:
- Modeless, user friendly interface
- Seamless transition between modules, e.g. GIS to Analysis to Tabular Results
- Graphical display, input and editing of any network element
- Non network data may also be displayed as background, e.g. parcel and street layouts
- Data for all entities required for modelling (pipes, rising mains, manholes, pumps etc) is included in the GIS database, with extra fields for other attributes
- Graphical display of results and data, through colour coding, arrows on pipes, different line thickness, different node sizes, etc., is available
- Graphical display is always geographically correct, and not schematic.
- Bitmap images can also be imported as backdrop or downloaded on the fly from imagery web services
- Detailed grid-base data and result presentation with filtering capabilities
Model-CAD Interface
The Sewsan system is an analysis tool coupled to a GIS interface. All the model entities (pipes, manholes etc.) are stored in an GIS database, and are displayed on the map. Sewsan therefore consists of:
- The sewer model representing the physical components of the sewer system
- The GIS interface, used to display the modelled data and results
By using the layer functionality of the GIS environment various background drawings/images can be imported into the current drawing so that the system can be displayed against this background information. Such drawings/images include for example:
- The cadastral layout of the study area
- GIS shapefiles
- A bitmap image of the aerial photograph
- Contours of the study area
The CAD/GIS interface provides a user friendly, interactive environment for capturing system data and setting up a model. The CAD/GIS interface is used to:
- Convert a drawing or external shape file of a system into a model
- Capture text from a drawing into the corresponding model parameter
- Display the system graphically
- Easily edit the topology of the system by adding, moving or deleting the entities
- Interrogate (and edit) the data and results of a model entity
- Select model entities either manually or by querying the data or results
- Edit a selection of model entities
- Perform comprehensive queries on the system data and results
- Print accurate plans of the system, including any background drawings which might be necessary
Model Population and Swift
Sewsan models can be directly linked to Swift in order to populate the model with accurate flow data. Swift populates the flow (AADD) associated with each manhole in the system for 5 different flow scenarios. Swift also populates the fields representing the land parcels which discharge into the pipes.
Alternative population from GIS sources or tables is also possible.
Calibration and Summaries
The simulated flow hydrographs can be compared to calibration hydrographs. Any number of calibration hydrographs can be linked to the system at the relevant nodes.
In order to facilitate the calibration of the sewer network system summaries can be made. The summaries can be made for the entire system, the system upstream of a selected manhole or for a selection of manholes and pipes.
- The system summary table tabulates information in the system regarding the
- Pipe Topology: Length, type and number of pipes,
- Structure Topology: The number and type of structures and pumps
- Volumes produced by each component of the contributor hydrograph and user hydrographs
- Detailed breakdown of the number of land parcel units associated with each unit hydrograph and the volume contributed for each.
The volumes are theoretical volumes based on the input hydrographs and may differ from the simulated volumes due to the nature of the system (lag) and the time step at which the system was analysed. However, this gives a useful and accurate indication of the flow in the system
Result Presentation
|
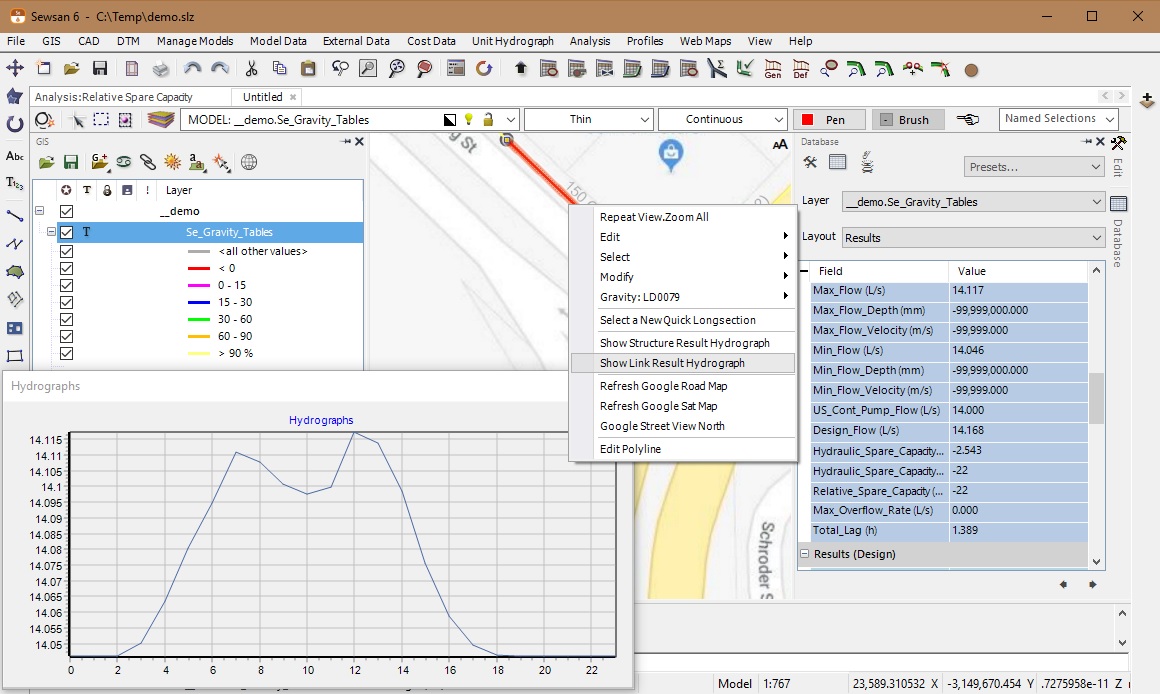
| Result hydrographs and tables |
|
Sewsan provides for an extremely flexible query system in order to map data and results. For both nodes and links additional data can be included in user-fields. This allows for the inclusion of information pertaining to age, material and classifications etc. of pipes, present and future allocation of stand numbers etc. to nodes, over and above the normally required data defining the component.
A link and node legend is provided in the GIS layer manager, in which the colour coding parameters for any one of the link or node data fields can also be changed. Standard map themes are available to show output data such as the spare capacities, flow, flow velocities etc with different colour coding and different line widths. This can also be customized by the user.
In GIS layer manager it is also possible to turn on and off either the node display, so that only pipes are mapped, or the pipe display so that only nodes are mapped.
Text from the different fields can also be annotated to the nodes and links. Specific fields can be selectively annotated, e.g. the link number and pressure, or diameter.
Graphs
Graphs can be displayed for the results of any link or any node, for the entire time period. Graphs of the unit and user hydrographs as well as the simulated flow in any pipe or manhole can also be displayed.
The different components of the simulated flow hydrographs can also be displayed. These include:
- The total flow in the structure
- Infiltration into the system upstream of the structure
- The average flow contributed to continuous pumps upstream of the system
- The capacity of the pipe
Reports
|
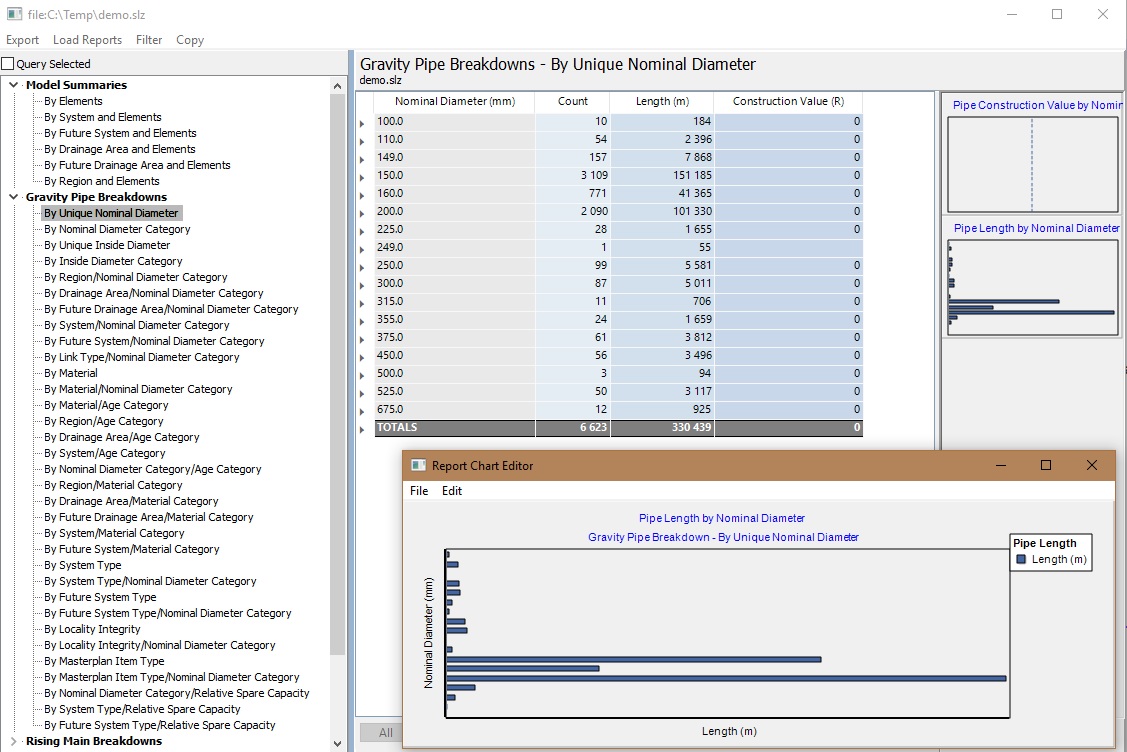
| Extensive SQL-based reports |
|
The presentation of data in tables is done through live grids. Any changes made in a table automatically gets updated in the GIS map as well as in any open property boxes. Grids can be filtered and sorted and provide a very powerful view of large datasets
In addition many predefined SQL-based reports are available which can be run on the complete dataset or on only a selection.
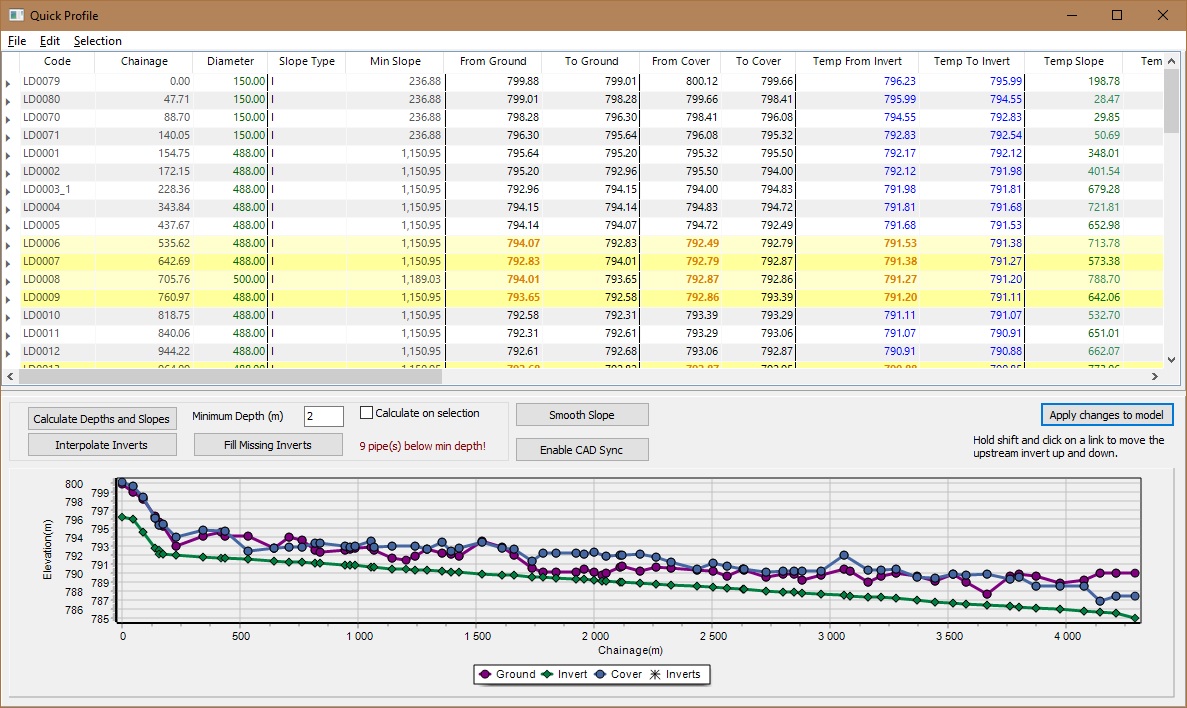
Profiles
User selected routes for profiling a longitudinal section can be specified graphically in the Sewsan map interface. A profile, display an/or plot showing ground elevation, invert levels and the calculated water level for the route is available. Two displays are available: A Quick Profile tool allows for interactive changes to elevations and the more advanced GIS profiler, renders profiles in the CAD/GIS environment in a new drawing.
Model Size Requirements
The number of pipes that can be simulated in Sewsan is theoretical unlimited and depends solely on computer resources and the option licensed. The possibility therefore exists to build large models, including all pipes in a system, thus improving modelling accuracy.
|